Get Core Web Vitals, performance scores, and actionable speed recommendations powered by Google Lighthouse.
Enter any URL — we'll run a full Lighthouse performance audit.
Running Lighthouse audit…
This typically takes 15–30 seconds.
What this tool measures
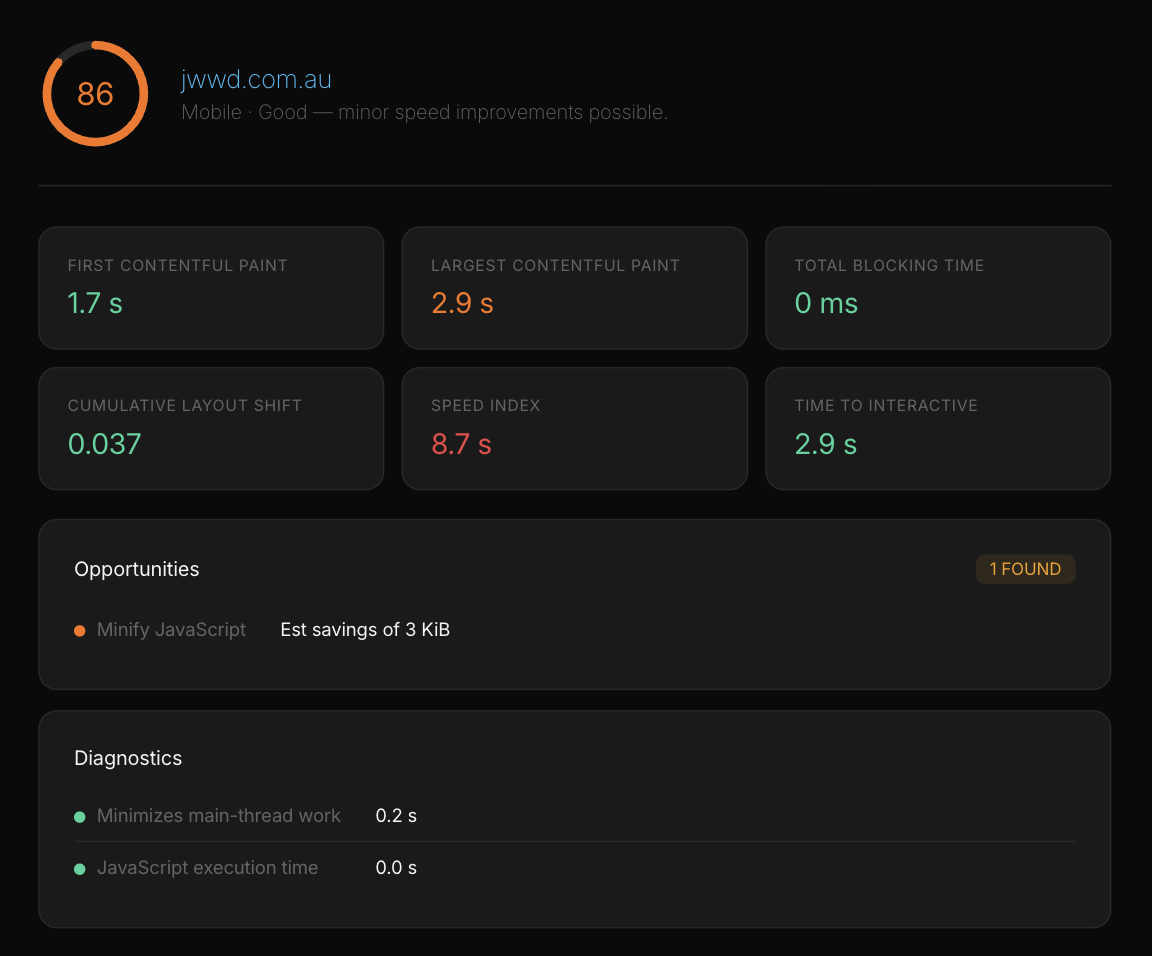
A real mobile report — score 86, with every Core Web Vital measured and one remaining opportunity identified.
Site Speed Check runs a full Lighthouse performance audit against any public URL using Google's PageSpeed Insights API. It tests both mobile and desktop in parallel and reports the metrics that actually move the needle for search rankings and user experience — not the dozens of incidental audits that turn most performance reports into noise.
The metrics we report
Largest Contentful Paint (LCP) — when the main content finishes rendering. Good: under 2.5s.
Interaction to Next Paint (INP) — how responsive the page feels to clicks and taps. Good: under 200ms. (INP replaced First Input Delay in March 2024.)
Cumulative Layout Shift (CLS) — how much content jumps around as the page loads. Good: under 0.1.
First Contentful Paint (FCP), Speed Index, Total Blocking Time (TBT), and Time to Interactive (TTI) — supporting metrics that help diagnose where any Core Web Vital problem is coming from.
How to read your report
Each metric is colour-coded: green is good, orange is "needs improvement," red is poor. The Opportunities section lists fixes Google's audit identified, sorted by estimated savings — start at the top, the highest-impact fix is almost always the right place to begin. The Diagnostics section shows underlying issues (long main-thread tasks, oversized DOM, third-party script weight) that explain why the metrics are where they are.
Mobile scores are almost always lower than desktop because the test simulates a mid-range phone on a throttled network. Google's mobile-first indexing means mobile is what counts for search rankings — if you only have time to fix one profile, fix mobile.
Lab data vs. field data
This tool reports lab data: a single, controlled test run that's perfect for diagnosing problems and validating fixes before you ship them. Field data — what real users experience — is collected separately by Google's Chrome User Experience Report (CrUX) and is what actually feeds your Search Console rankings. Lab and field can disagree, especially for sites with low traffic or unusual user populations. Use both: lab to debug, field to confirm impact.
Who built this
JW
Jason Williams · Founder, JWWD · Central Coast, NSW
Founder, JWWD · Central Coast, NSW, Australia
Jason Williams is the founder of JWWD, an independent web development studio on the Central Coast of NSW, just north of Sydney. He builds and operates ModusOp, a platform for SEO monitoring, client and project management, AI chat and phone reception. His day-to-day is production web software across WordPress and Shopify — and the SEO work behind this tool is work he actually runs: Search Console indexing inspections, rank tracking, sitemap and canonical audits across client sites.
Yes — completely free, no signup and no credit card. Scans are rate-limited per visitor so automated traffic can't exhaust the tool for everyone else. We run it because we use it ourselves when diagnosing slow client sites. Ads on the page help cover hosting, but the tool itself will always be free to use.
What are Core Web Vitals?
Core Web Vitals are a set of three metrics Google uses to measure real-world user experience: Largest Contentful Paint (LCP) measures how long the main content takes to render, Cumulative Layout Shift (CLS) measures how much the page jumps around as it loads, and Interaction to Next Paint (INP) measures how responsive the page feels when users interact with it. Together they're a direct factor in search rankings, not just a nice-to-have.
What's a good LCP score?
Google's thresholds are 2.5 seconds or less for "Good," 2.5 to 4 seconds for "Needs improvement," and over 4 seconds for "Poor." If your LCP is above 4 seconds, that's your top priority to fix — it's almost certainly hurting both your search rankings and your conversion rates.
Why is my LCP slow?
The most common causes are a slow server response (high TTFB), a large hero image that isn't optimised, render-blocking JavaScript or CSS, or client-side rendering that delays the first paint. Our report identifies which of these is the biggest contributor on your specific page, so you know exactly what to tackle first.
What's TTFB and why does it matter?
Time To First Byte is how long it takes for the server to start sending the response after the browser requests a page. It's the foundation everything else builds on — you can optimise images, compress CSS, and lazy-load scripts all you want, but if TTFB is 2 seconds your LCP will never be under 2.5. Target under 600ms, ideally under 200ms.
How is this different from Google PageSpeed Insights?
PageSpeed Insights is excellent and we recommend using both tools. The difference is workflow: PSI can be slow to load, overwhelms you with dozens of audits at once, and is sometimes hard to interpret. Site Speed Check focuses on the handful of metrics that actually matter, explains them in plain English, and prioritises fixes for you. Use PSI when you need the full exhaustive audit; use us when you want a quick, clear answer.
Do you test on mobile or desktop?
We test both and report them separately. Mobile performance is usually weaker (slower CPUs, worse network conditions) and is the one Google weights most heavily for ranking, so if you only have time to fix one, fix mobile first. Our report highlights the worst-performing profile so you know where to focus.